The Double Top Pattern
A double top is a reversal structure made of two peaks at roughly the same height, separated by a pullback, with a line called the neckline drawn along the low between them. It is studied as a sign that an existing uptrend may be losing strength.
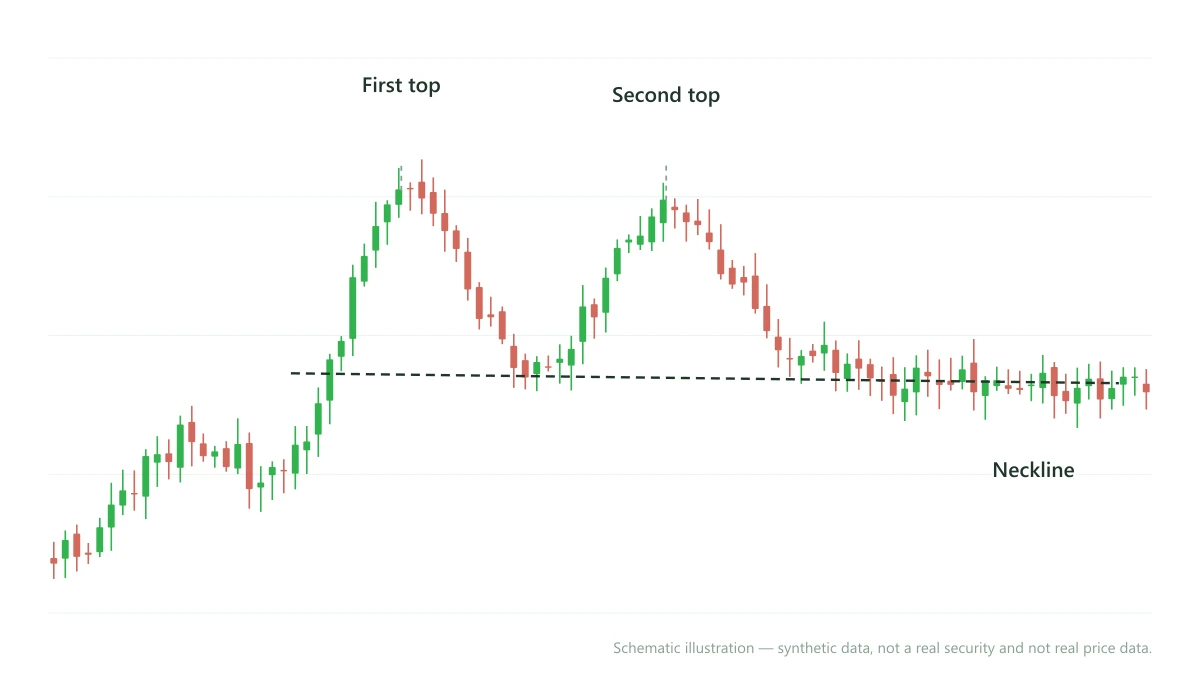
What the pattern looks like
Read left to right, price advances and stalls at a first peak, pulls back to a low that holds, then advances a second time into roughly the same zone and stalls again. The two peaks are the tops; the line drawn along the pullback low between them is the neckline.
The structure matters because the second push could not better the first — it is a picture of a trend that has stopped making progress. Roughly equal is the operative phrase: the two tops rarely match exactly, and a modest overshoot or undershoot on the second is normal. What you are reading is a failure to extend, not a measurement to the tick.
How the pattern forms
An uptrend has to be in place first — without a prior advance there is nothing to reverse.
- The advance stalls and forms the first top.
- Price pulls back to a level that holds; that low defines the neckline.
- A second advance retests the area of the first top and stalls in the same zone, forming the second top.
- The structure is complete only when price closes decisively beyond the neckline. Until then it is an outline, not a pattern.
Time matters as much as shape. The two tops normally separate by a meaningful number of sessions; two peaks a couple of bars apart are noise, not structure.
The psychology behind the two tops
The first top is where an advance meets enough supply to halt it. The pullback brings in buyers who still read the trend as intact, and the second advance is their attempt to carry it further. When that attempt stalls in the same zone, it tells you the buyers driving the trend could not absorb what was waiting for them there.
There is a second group in the picture: traders who bought into the first top and have been holding a loss since. Near the second top they are close to breakeven, and some of them take that exit — which adds to supply exactly where the advance is already struggling.
The neckline is where these groups meet. It has held once, everyone can see it, and a decisive close beyond it removes the level the structure was resting on. Volume often eases on the second top compared with the first, which is consistent with fading participation — read it as context, not proof.
Validation rules — when the shape counts
Treat the shape as a pattern only when all of this is present:
- A prior uptrend to reverse.
- Two peaks in roughly the same zone, with neither dramatically higher.
- A genuine reaction between them, not a shallow pause.
- Visible separation in time between the two tops.
- A neckline you can draw cleanly along the pullback low.
- A decisive close beyond that neckline — a wick through the line, on its own, is not the same thing.
Miss any of these and what you have is a possibility, not a pattern.
Where the structure is confirmed, and where it stops being valid
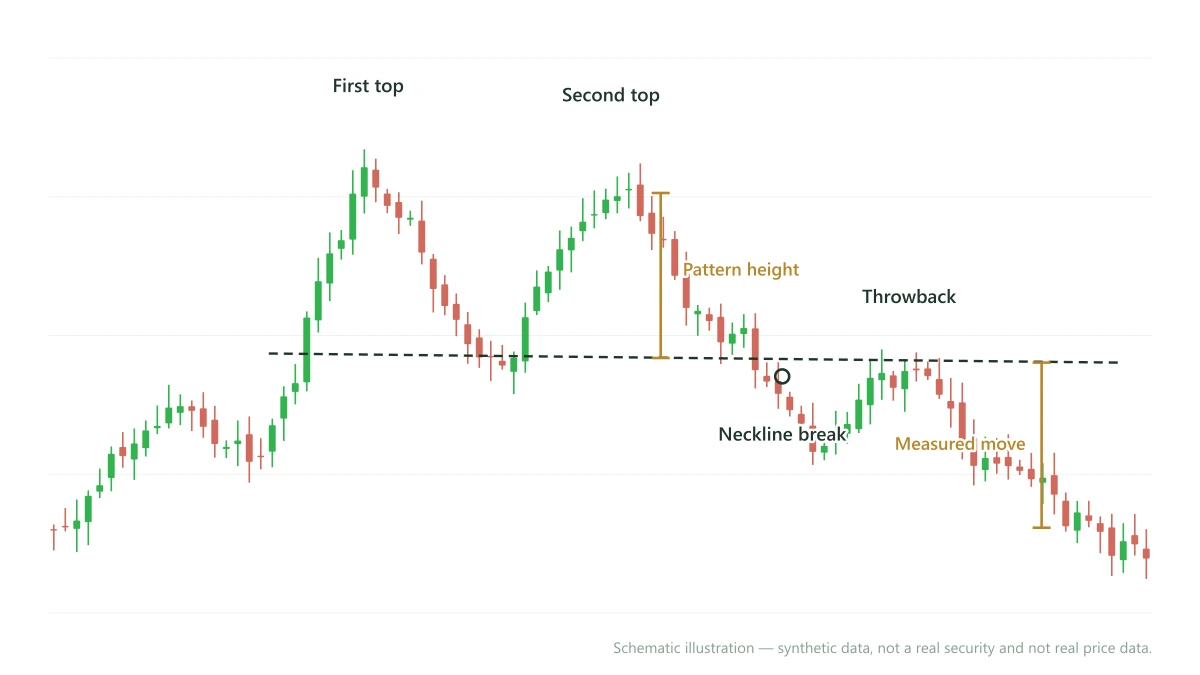
Confirmation is conventionally taken as a decisive close beyond the neckline. Some readers wait for price to come back to the line from the other side — a throwback — before treating the break as settled, and that retest is a useful place to study how the structure behaves.
The reading is invalidated when price recovers above the higher of the two tops: the failure to extend that defined the pattern no longer holds, so the structure is gone. Between the neckline and the tops it is simply unresolved — neither confirmed nor invalid.
On scale, the vertical distance from the tops down to the neckline, projected from the break point, is taught as a way to understand the pattern's proportions. That is a concept for reading structure, not a forecast. We teach where a reading stops being valid; we do not tell anyone what to buy or sell, and nothing here is a recommendation.
Common failure cases
- The break that does not hold. Price closes beyond the neckline and then recovers back inside the structure.
- Forcing the shape. Any two bumps on a chart are not a double top.
- A second peak far above or below the first. That is a different structure being read as this one.
- No context. Reading the pattern without the wider trend, or without a second timeframe.
- Treating the measured move as a promise rather than a way of thinking about scale.
How we teach it at Market Credo
In the classroom we teach the double top from first principles — why the structure forms, what the neckline represents, how it is confirmed and when it is no longer valid — so you can read it on any chart yourself. The aim is an independent reader of price, not someone who depends on ready-made trades.
Related patterns.
- Head and Shoulders — the near neighbour: three peaks with a higher middle one instead of two tops of equal height, resting on the same kind of neckline and read the same way once the line breaks.
- Double bottom — this pattern inverted, forming at the end of a downtrend. Same logic, mirrored.
The full pattern library sits inside the course syllabus — see the 60+ chart patterns we cover, or the classroom course in Bhopal. Every published guide is listed on the chart patterns hub.
Frequently asked questions.
Is a double top a bullish or bearish pattern?+
How equal do the two tops have to be?+
What is the difference between a double top and a head and shoulders?+
Learn to read chart patterns properly.
Study chart structure and price action from first principles with SEBI-registered analyst Atish Shakergaye. Start with a free 2-day demo.