The Head and Shoulders Pattern
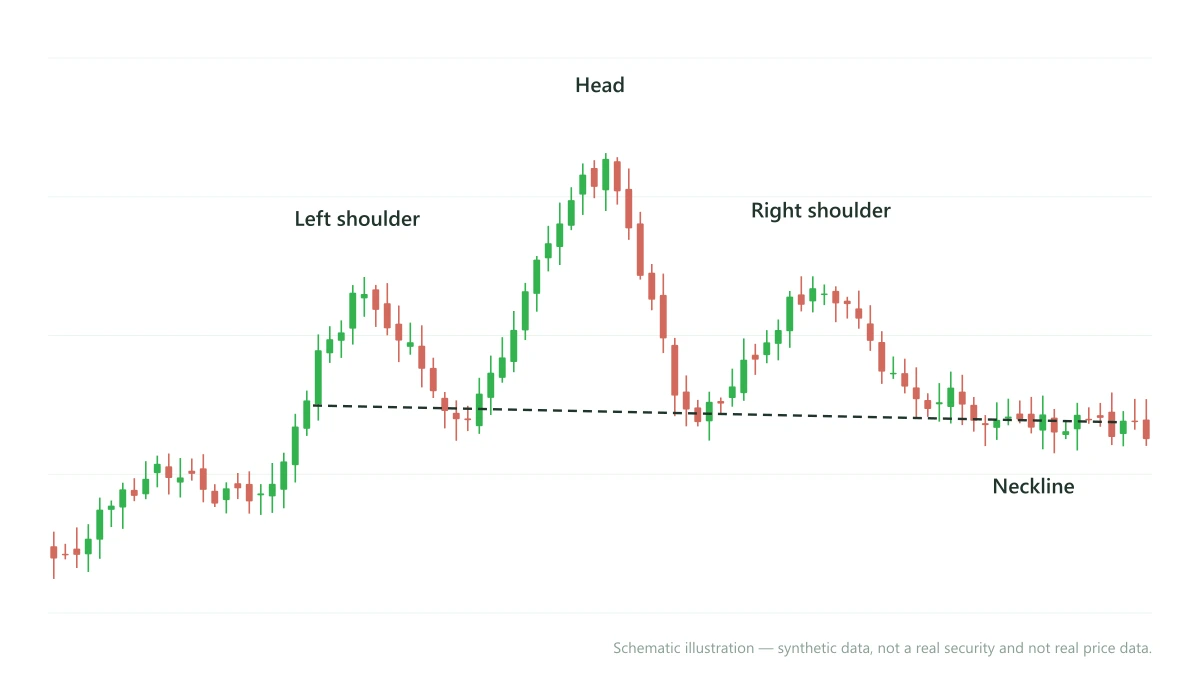
The head and shoulders is a reversal structure made of three peaks — a higher middle peak (the head) between two lower, roughly equal peaks (the shoulders) — resting on a line called the neckline. It is studied as a sign that an existing uptrend may be losing strength.
What the pattern looks like
Read left to right, the shape has three pushes higher. The first push forms the left shoulder. Price pulls back, then rises to a higher point — the head — before pulling back again. A third push rises to about the height of the first, forming the right shoulder. The two pullback lows in between define the neckline.
The pattern matters because the second lower peak (the right shoulder) shows buyers were unable to push price back to the previous high. That loss of momentum is the whole idea — the structure is a picture of a trend running out of fuel.
The neckline is the key line
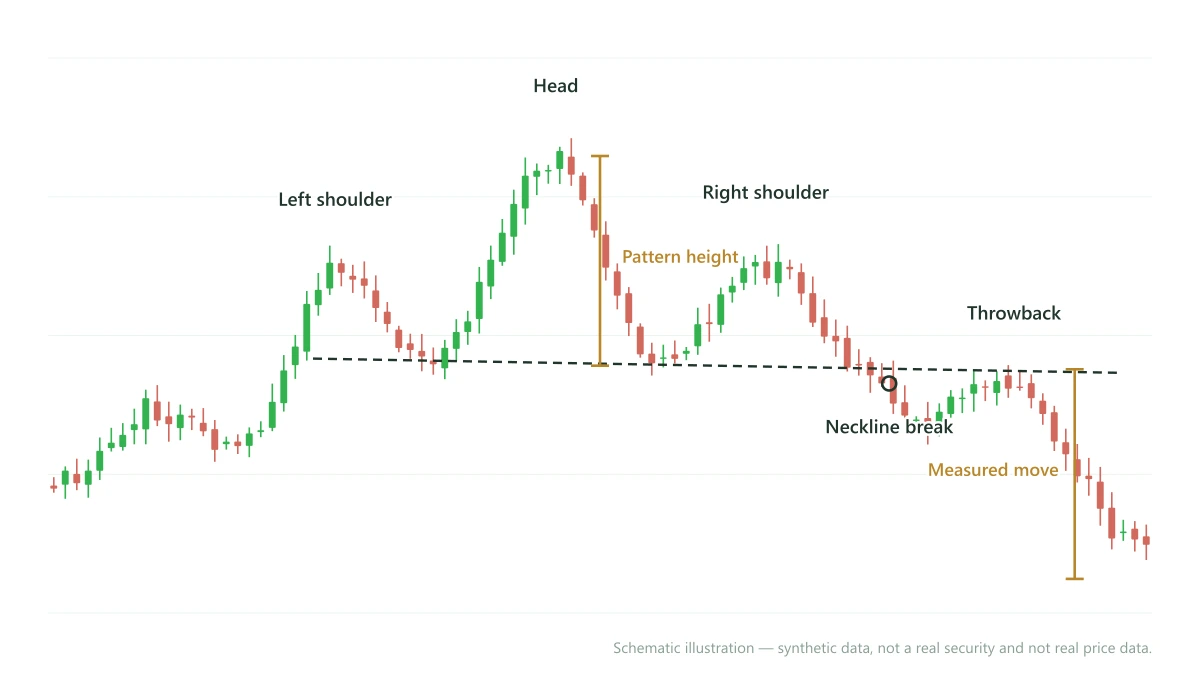
Draw the neckline by connecting the two pullback lows either side of the head. Until price closes clearly beyond that line, the shape is only a possibility — an outline, not a confirmed pattern. Most readers treat a decisive close beyond the neckline as the point where the structure is confirmed.
- A neckline can be flat, rising or falling — the angle is part of what you read.
- After a break, price sometimes comes back to the neckline from the other side (a throwback) before continuing. That retest is a common place to study the pattern's behaviour.
Volume and the story it tells
Volume often eases as the pattern develops — frequently lighter under the right shoulder than under the head. That fading participation is consistent with the idea of a weakening trend. Volume is context, not proof: read it alongside the structure rather than on its own.
The measured move, as a concept
Students often ask how far a move might carry after a neckline break. As an educational concept, the vertical distance from the head to the neckline can be projected from the break point to give a sense of scale. Treat this as a way to understand proportion in the pattern — not as a forecast, and never as advice to act.
The inverse head and shoulders
Flip the pattern upside down and it forms at the end of a downtrend instead: a lower middle trough (the head) between two shallower troughs (the shoulders), under a neckline. It is studied as the mirror image — a downtrend that may be losing strength.
Common mistakes when reading it
- Forcing the shape. Not every three-peak wiggle is a head and shoulders. The shoulders should be roughly symmetrical and the head clearly higher.
- Ignoring the neckline. An unbroken neckline means the pattern is unconfirmed. The outline alone is not enough.
- Reading it in isolation. The pattern is one piece of structure. Weigh it against the wider trend, support and resistance, and overall context.
How we teach it at Market Credo
In the classroom we teach the head and shoulders from first principles — why the structure forms, what the neckline represents, and how to confirm it — so you can recognise it on any chart yourself. The aim is an independent reader of price, not someone who depends on ready-made trades.
Related patterns.
- Double Top — the two-peak relative: two tops at roughly the same height instead of three peaks with a higher middle one, resting on the same kind of neckline and read the same way once the line breaks.
- Inverse head and shoulders — this pattern turned upside down at the end of a downtrend, as described above.
The full pattern library sits inside the course syllabus — see the 60+ chart patterns we cover, or the classroom course in Bhopal. Every published guide is listed on the chart patterns hub.
Frequently asked questions.
Is the head and shoulders a bullish or bearish pattern?+
How do I confirm a head and shoulders pattern?+
Learn to read chart patterns properly.
Study chart structure and price action from first principles with SEBI-registered analyst Atish Shakergaye. Start with a free 2-day demo.